Discover Eclipse Che 7
Eclipse Che 7 has been announced few days ago, if you have not yet tried it, it’s time to experiment with all the new exciting capabilities!
This guide will drive you through different steps and allow you to experiment Che 7. To follow this guide, you’ll not need to install Che on your machine or your K8S cluster, we’ll just be using a free online instance of Eclipse Che that is running at https://che.openshift.io
It’s a free-to-use instance that is powered by latest Eclipse Che 7 version and providing 3GB of memory for a single workspace. It requires a Red Hat Developer account but you can log-in with different third parties accounts like github, facebook, google, twitter, etc.
Pre-requisities
- Go to https://che.openshift.io and log-in or create an account.
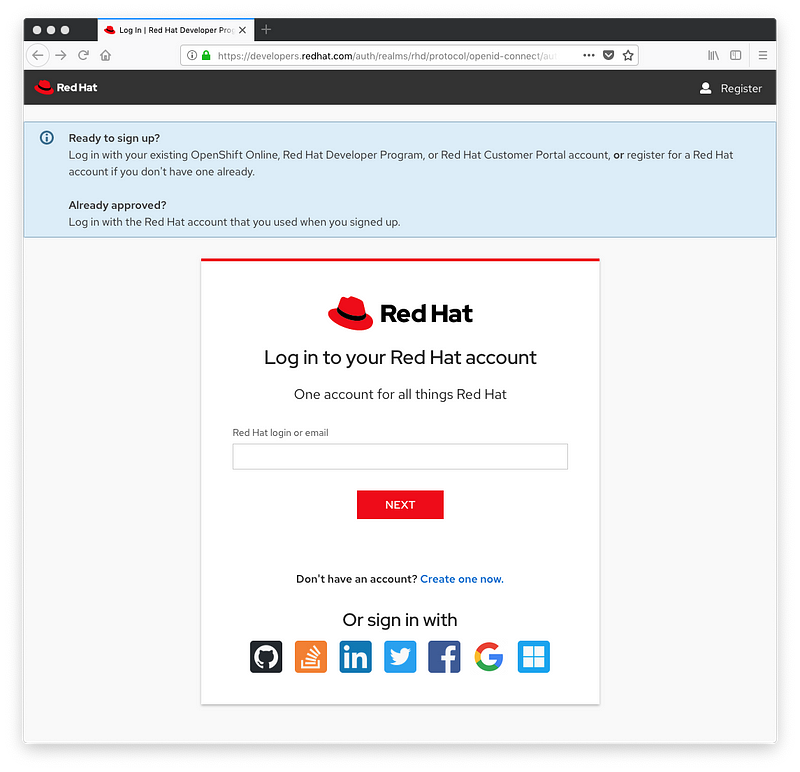
- After creating a new account or simply log-in, you’re redirected to the dashboard page of Eclipse Che
Discovering Che Workspaces
Eclipse Che is using containers under the hood. It means all runtimes used in workspaces can be customized by some docker images: for example java runtime, nodejs runtime, etc. are provided on top of docker images.
But as it may be difficult to start by writing or providing first a Docker image, there are default ready-to-use workspace templates.
These ready-to-use workspaces are provided on top of community Docker images and are great to start to work on a given technology.
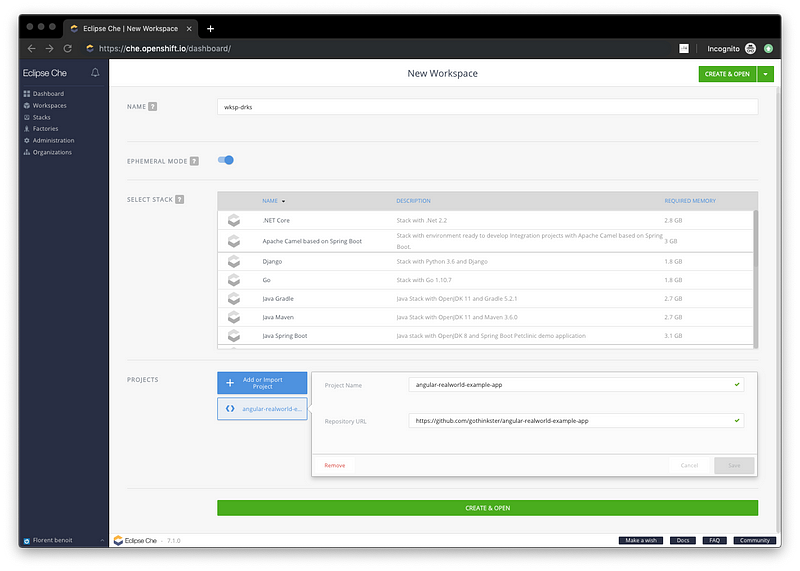
Create a workspace
Let’s create a simple go application
- On the dashboard, click “Create Workspace”
-
In the
select stacksection, click ongo -
Check that in
projectssection, example is selected
-
After clicking on
create & openbutton we’re redirected to the IDE
Note: we use
ephemeral mode
flag as we don’t care about persisting changes for demos and want
the fastest I/O storage.
Discover the new IDE!
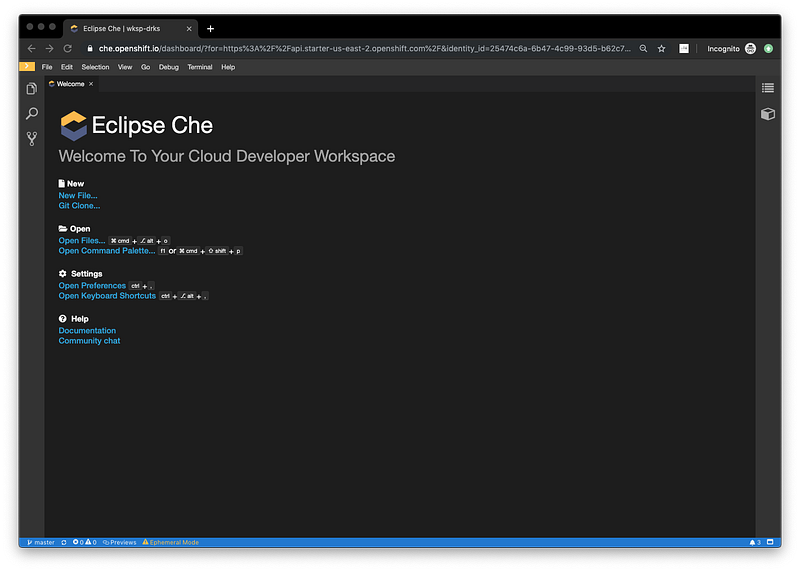
In the IDE, there are several useful areas/panels.
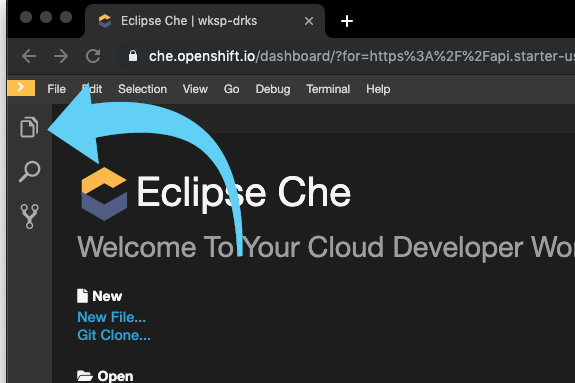
Clicking on the top left file icon will display all the files of the current workspace.
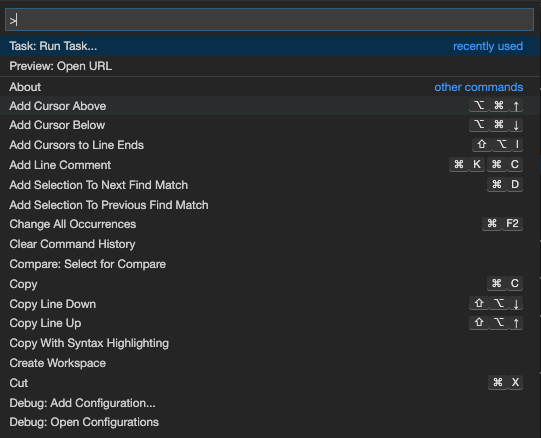
Command palette
Press
F1 key
or click on the
command palette
link in the
Welcome Panel. Enter some keyword to filter out commands. Formatting can be
done easily with a specific command invoked from command palette.
Keyboard shortcuts are displayed on the right of the command. No
need to bring command palette and select a command if you already
know its shortcut.
Workspace panel
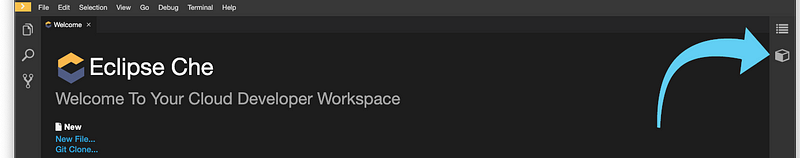
The workspace panel is a quick view allowing to interact with the workspace like launching pre-defined commands for this workspace or opening terminals.
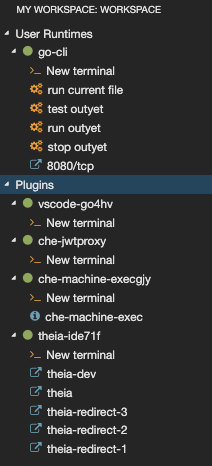
There are two kind of containers:
— Plugin’s runtime containers: containers provided by
plug-ins. It’s the execution runtime used by these plugins
— User runtime container: We may not have it at all or
more than one. It’s used to run some commands you would like. All
these commands can be found by using the command palette and using
Run Task
By clicking on a command name (single click, no double-click),
like
run outyet
it will invoke this command in the
go-cli
container. You may open a terminal as well from this view by
clicking on
New terminal
link. Terminals can be opened on any containers.
Status bar
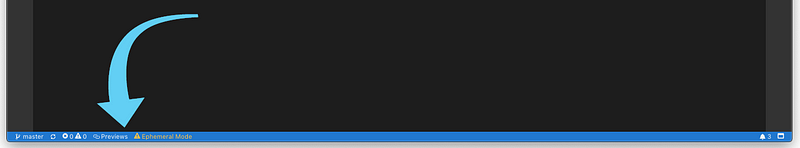
Blue bar means that IDE is remotely connected to the workspace
server. In case of connection failures, the bar will turn into
orange and there is a text saying
offline.
Information like git information orephemeral mode
are also displayed.
Language tooling
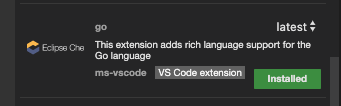
Ready-to-go workspaces are already providing the tooling for the selected language so no need to install plug-ins after in order to work on a project.
From the
view/Plugins
panel we can see that we already have
go
plug-in installed.
by opening file
src/github.com/golang/example/outyet/main.go
there is already syntax highlighting in the go file.
Debugging is also easy. Just create a new launch configuration for go.
Debugging the application
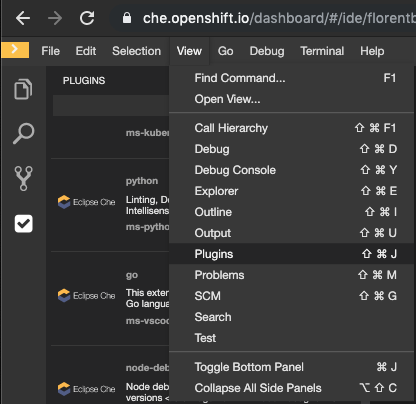
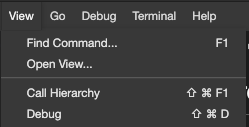
After opening the debugger panel by going into the menu:
View --> Debug
Then, in the Debugger panel, click on the dropdown of the
configurations and click on
Add Configuration...
note: it’s also possible to add configurations by clicking in
menuDebug/Add Configuration...
Using the code completion, select the
Go: Launch file
entry and let the default.
Now, just hit some breakpoints in the code by clicking on the space before the line number
And launch the debug configuration (default name will
Launch File
)
All options like step-in, step-out, resume, etc. are available in the debugger.
Inline operations are also available in the editor when you edit test files.
Opening file
src/github.com/golang/example/outyet/main_test.go
file and then going on test functions will display run/debug
options.

Now, you’re ready to experiment Eclipse Che on your own!
Get Involved!
Join the community:
- Support: You can ask questions, report bugs, and request features using GitHub issues.
- Public Chat: Join the public eclipse-che Mattermost channel to discuss with community and contributors.
- Weekly Meetings: Join us in our Che community meeting every second monday.
- Mailing list: che-dev@eclipse.org